BIA/Kelsey Bytes are excerpts from research reports. This is the latest installment from the recently launched report, Call Commerce: A $1 Trillion Economic Engine. It picks up where last week’s post left off.
The report can be downloaded for free here.
Where Do Calls Go?
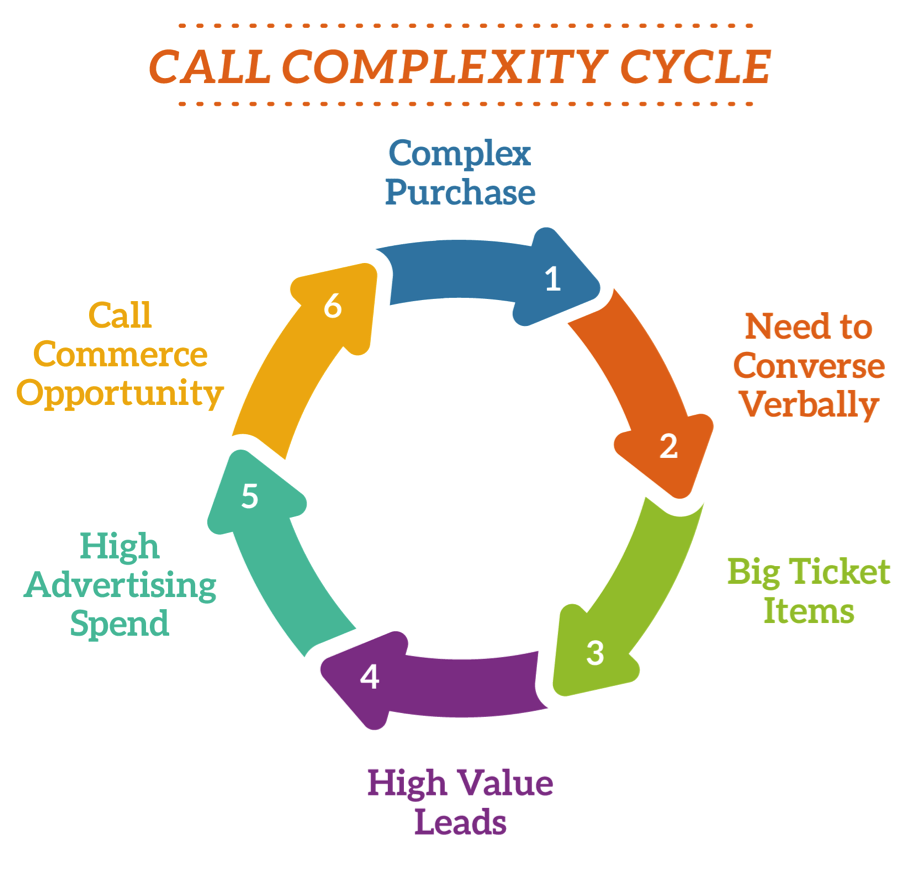
Equally important as the source of mobile-driven phone calls is their destination. In other words, what are the vertical business categories receiving the most phone calls? They tend to be categories that include products with a certain degree of complexity, which equals verbal nuance.
Such complexity correlates to price, which in turn correlates to “consideration cycles” that involve human conversations. And products with large price tags tend to place premiums on inbound leads. Therefore these categories hold large monetary opportunities for call commerce.
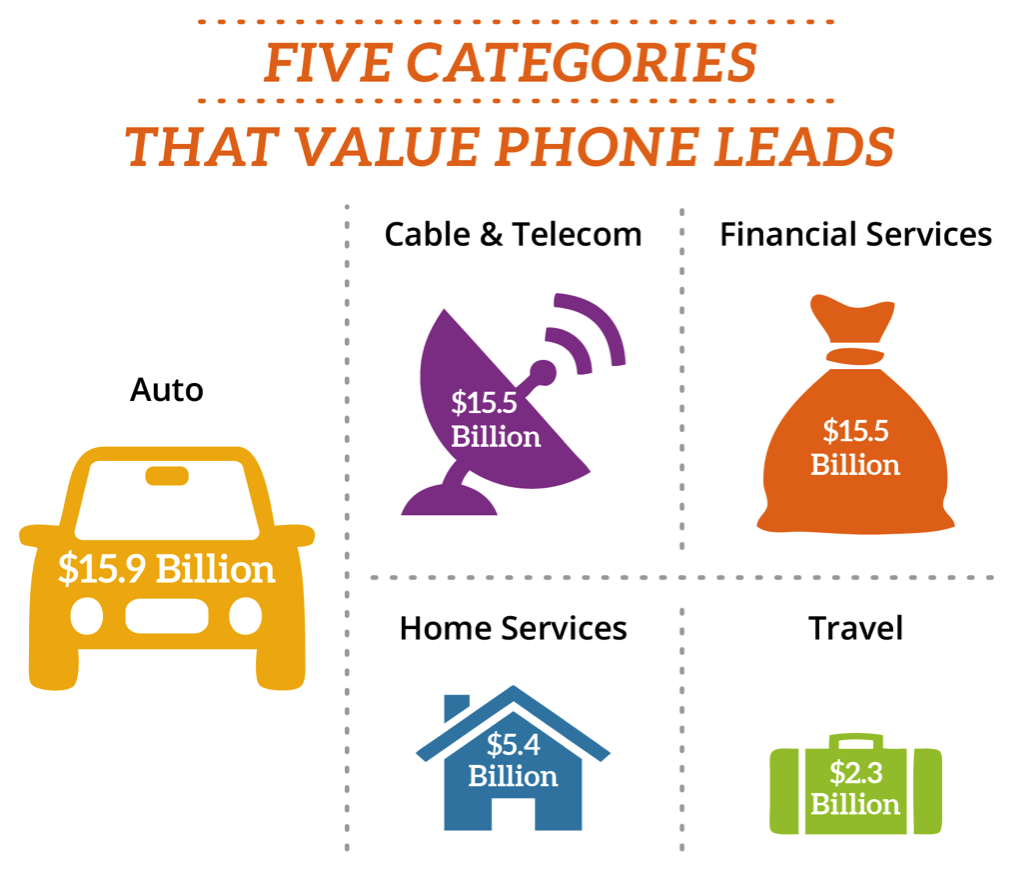
Using ad spend as a proxy for the call commerce opportunity, autos is the leading category. Rounding out the top five are cable and telecom (i.e., cellular contract), financial services (i.e., life insurance policy), home services (i.e., roofing job) and travel (i.e., booking family vacation).
Supporting this, Google reports dollar values in product-specific scenarios where a call is likely to happen. The auto category is at the high end of this scale at roughly $1,200. This further quantifies the monetary levels of call commerce and, by extension, the lead values that are possible.
What Is Click-to-Call Worth?
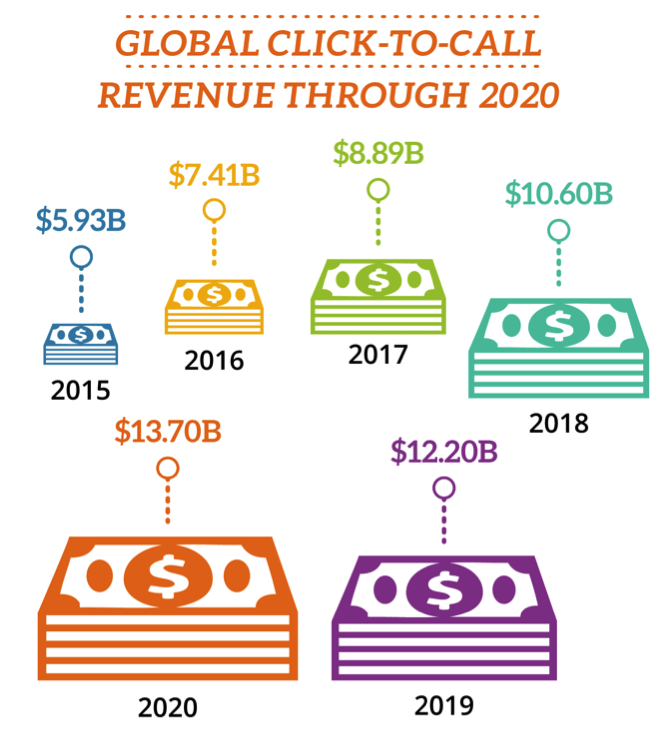
Panning back, how much is spent annually on clicks that launch phone calls from mobile devices? Based on call volume and click-to-call rates across various call sources, BIA/Kelsey pegs global click-to-call spending at $5.9 billion last year, growing to $13.7 billion by 2020.
It’s important to note that this global spending figure is just one segment of the call commerce opportunity — the first step in its value chain. There are downstream functions, such as call analytics and new areas of development, which we will explore and quantify further below.


