Brand marketers are keen to get grounded insights into how their investments in building brand equity pay off in incremental sales. To address this need, Kantar built a brand guidance system based on search and social signals as outcome indicators that show the power media spending as part of the overall funnel driving brand equity and sales outcomes. Digital analytics from search and social advertising channels provide easily accessible data and insight into how those platforms work but can’t provide a holistic view either of the full cross-platform media investment or the impact on brand equity and ultimately sales. These digital signals may be over-weighted in assessing campaign outcomes, especially when marketers rely on last-click attribution models. Speaking at recent meeting of the New York-based Market Research Council, Kantar’s head of brand guidance analytics, Bill Pink shared Kantar’s work in developing an insights framework around signals of brand equity and demand drivers. Pink reported, “When we understand that a person’s attitudinal predisposition toward a brand is predictive of their long-term patterns of behavior across occasions, we can start to understand how brand equity aligns with longer term changes in base sales – which are typically the majority of a brand’s overall sales.”
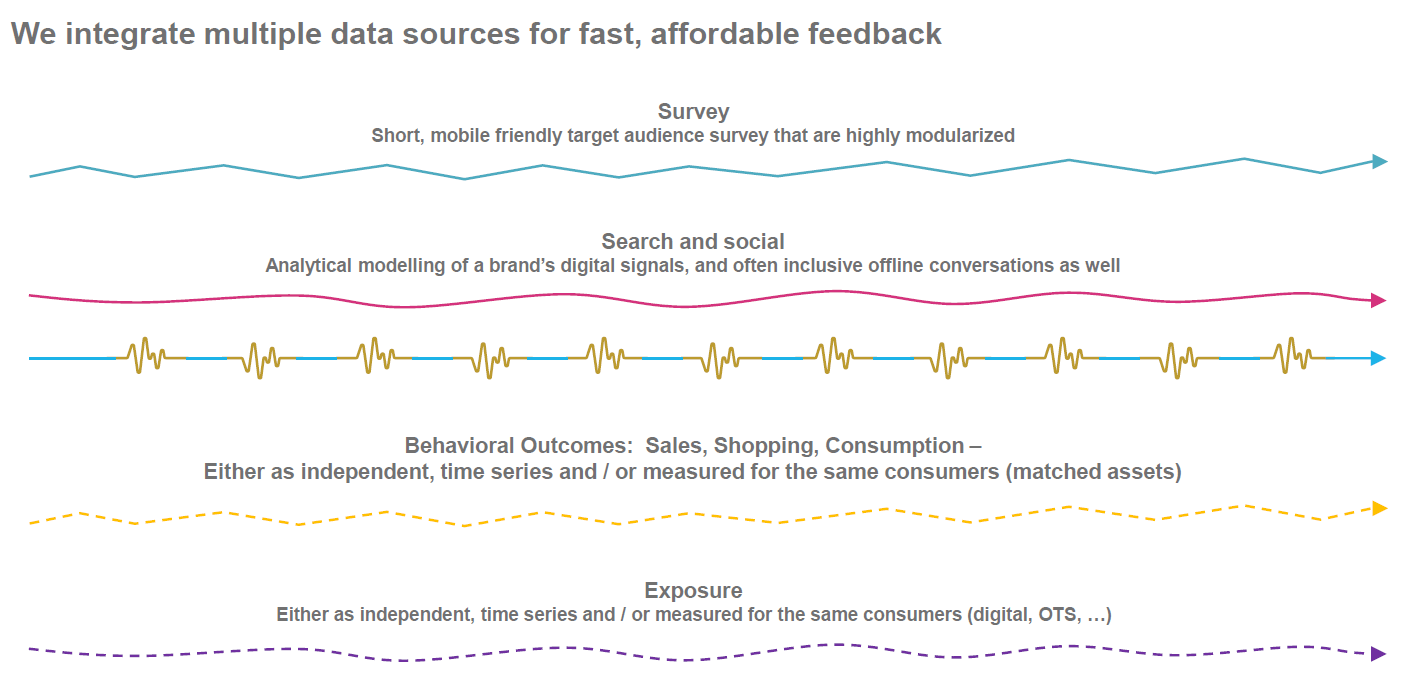
The key in Kantar’s approach to developing a brand tracking system is modeling how search and social signals map to behavioral outcomes such as sales, shopping, consumption. Kantar’s model draws from both human and machine learning to build its insight frameworks from a mix of survey data, analytical modeling of brands’ digital signals, and time series behavioral metrics. Pink told us that, “In most of our programs we have both ongoing search and social data as well as a spine of ongoing survey data with the same core questions asked over time. We then build the survey modules on top of that consistent spine. On the survey side this gives us a trend in branded memories among consumers and the ability to deep dive into hot topics. So the signals are really coming from a mix of passive data (search, social) and survey data.”
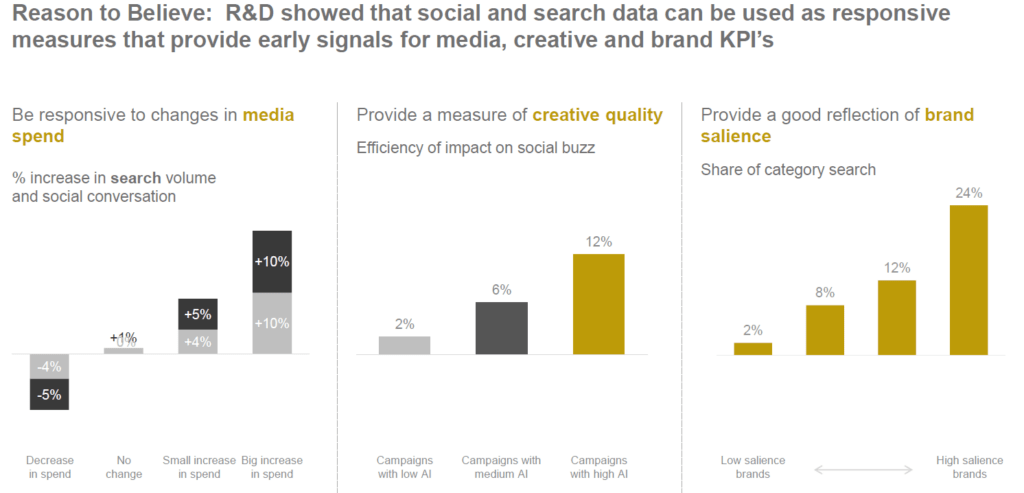
Social and search data can be used as leading indicators to signal impacts of media spend, creative quality, and brand salience. In the chart below, Pink highlighted that bigger media spend drives increases in search volume and social conversations. Further, higher quality creative drives social buzz more efficiently, and finally, a good measure of brand salience is its share of category search.
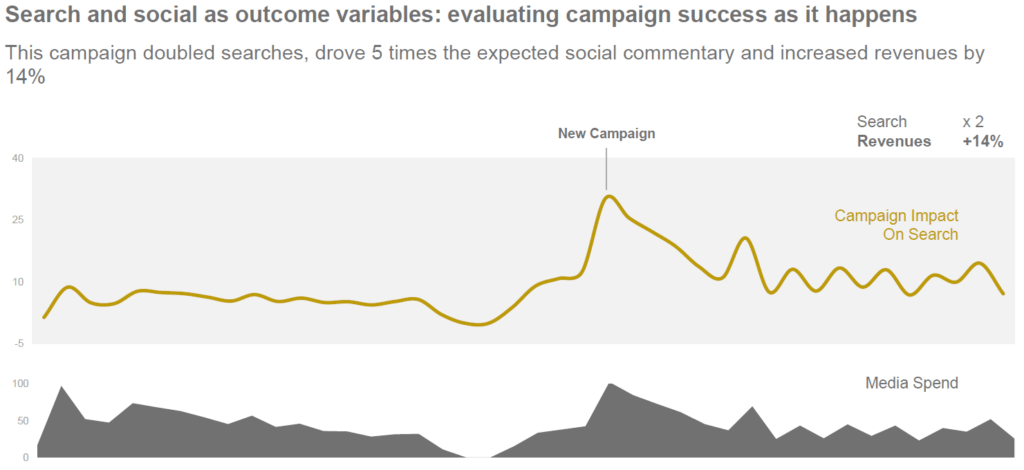
Taken together, the impact can be tremendous. Pink shared one case study using search and social to evaluate the campaign’s relative success in real-time. Pink noted that, “This campaign doubled searches, drove 5 times the expected social commentary and increased revenues by 14 percent.”
The relationships among media spend, impacts on driving search, and ultimately revenue are shown in the graph above. For brand marketers, this type of modelling provides a compelling framework for better understanding how important media spend is in the overall marketing mix for building brand equity and how social and search signals can provide real-time insights into campaign outcomes provides a powerful tool in their marketing arsenal.
Kantar’s work shows a clear linkage between upper funnel media activation and lower funnel brand equity and revenue outcome metrics. This can inform both marketers and media sellers seeking deeper understanding of the marketing mix beyond last-click attribution models to see the full impact of higher funnel media investments.


