NOTE: This post was revised 9/21/18 to correct an editing error.
As BIA works with clients to strategize revenue growth prospects for local TV, we’re considering the Total Addressable Markets (TAM) for broadcast television versus digital platforms. It’s a tale of two cities. Growth will come from the Digital TAM.
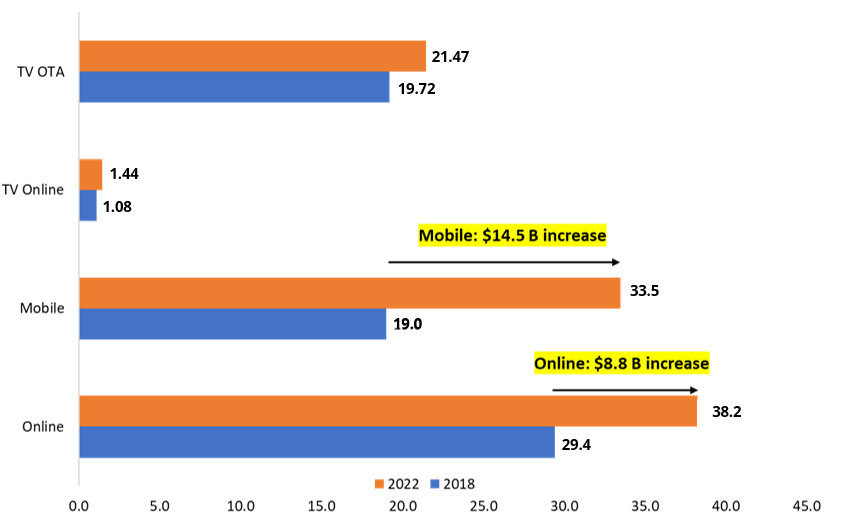
As shown in BIA ADVantage, our local market intelligence platform, we forecast that local TV will see $1.75 billion growth in core broadcast revenue and another $0.36 billion in digital revenue by 2022.
There are a lot of local TV stations competing for that $2 billion of increased spending over the next five years.
As a point of reference, while local TV competitive battles wage on for their share of local market TV spend, the Digital (Online and Mobile) will grow by almost $24 billion. In other words, just the growth in local Online and Mobile spending from 2018-2022 will nearly equal the size of the entire local TV ad market.
Even if we assume that Google and Facebook take out the lion’s share of local digital ad spend in the near term, eventually joined perhaps by Amazon and others, that still leaves a significant addressable market for local digital advertising by other publishers.
The challenge, and opportunity for local TV, is to develop growth strategies to participate in the local digital advertising market. Currently “TV Online” strategies tend to focus on selling “owned and operated” web sites and mobile apps, perhaps with some audience extension products and doses of Google and Facebook inventory. While these efforts are critical, when weighed against the overall growth in local digital, they pale in comparison.
- From here, local TV operators get a very specific view of what’s going on in their markets for digital spending and what media platforms are capturing those opportunities. Social, mobile, display, search, native ad categories are the fastest growing in digital.
- The next step is to evaluate where that spending is going by media platforms. Figure that the majority of this spending goes to Google and Facebook. That’s hard to compete with. We show those spending levels in BIA ADVantage by media brand.
- Finding a bigger play. The first step in the digital playbook for local TV operators is to size up the addressable digital spend in their markets and rank that by business verticals and digital platforms. BIA ADVantage, our local market intelligence platform, is one of the tools broadcast strategists and sales leaders can use to map out and quantify opportunities for digital ad spending in their markets.
- Now the hard work begins. Local TV has an awesome brand and content assets. For the most part these get monetized in over-the-air sales and somewhat on digital platforms. There’s a lot of money left on the table.
How can local TV grow beyond the airwaves to become significant players in local digital? Each market may have a different competitive story.
In our new report prepared for BIA ADVantage clients, Local TV’s $23 Billion Revenue Growth Opportunity: Is It Real?, we dive into these numbers and highlight some competitive strategies local TV groups can pursue. It’s all about focusing not just on competing inside the local TV ad spending share, but developing competitive services that attack the Digital Total Addressable Market. That’s where significant growth can be achieved.
BIA ADVantage subscribers can click here to log into the dashboard to view the report in the Reports & Webinars area. To request a copy, email sales@bia.com.
Industry Solution Sponsor
 2adpro, a global technology enabled marketing services company, providing local media solutions in the following areas: creative production, digital campaign management and adtech workflow consultation.
Questions? Please reach out to Pam Taylor, VP of North America at pam.taylor@2adpro.com.


