U.S. mobile ad revenues will grow from $25 billion last year to $72 billion by 2020.* That’s according to the mobile portion of BIA/Kelsey’s latest local media forecast, released today.
Of this total, location targeted mobile ad spend** will grow from $9.8 billion last year to $29.5 billion in 2020. That translates to 39 percent of overall mobile ad revenues, growing to 41 percent by 2020.
Drivers for this growth include mobile local intent, and advertiser evolution to follow that usage. There are also premiums associated with location targeted ads — a function of their performance and growing demand.
Getting Social
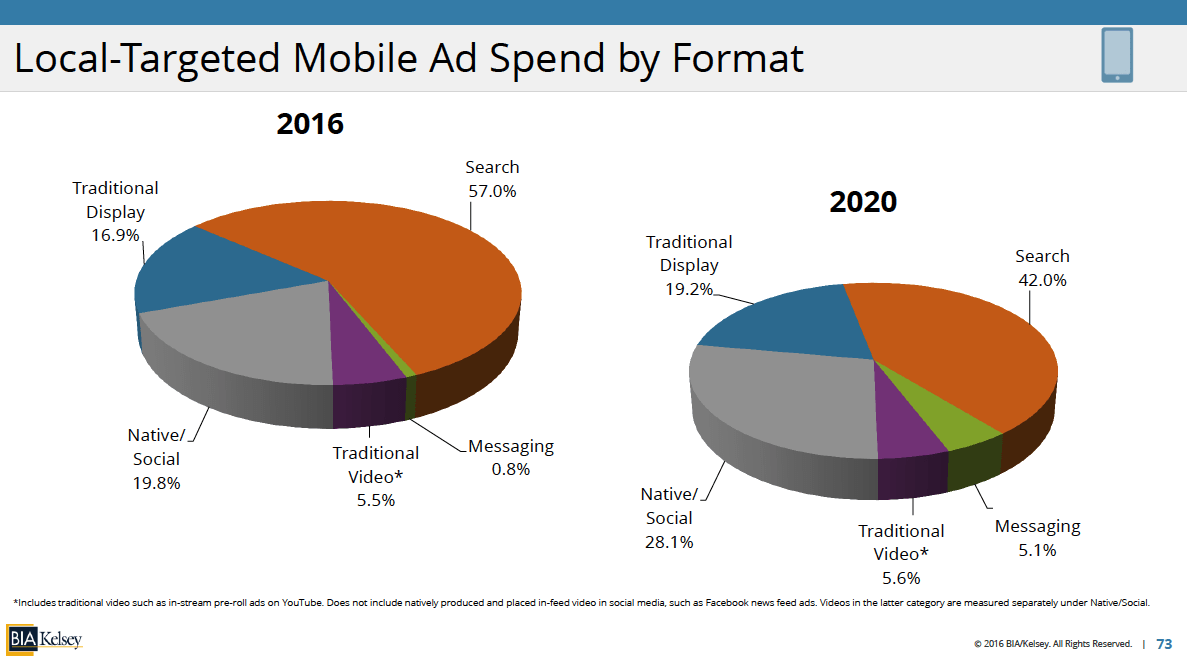
Total mobile ad spend can also be segmented by format. That includes search, display, messaging, video and native-social.*** The latter is growing the fastest which is probably the forecast’s biggest headline.
Facebook is leading the way with 80 percent of its ad revenue coming from mobile ads. This includes news feed ads (all of which are native-social) and it’s growing FAN third party app network (most of which is native-social).
Other reasons for the rise of native-social include:
— Instagram, Snapchat and others are making big moves to make their native social formats more attractive and impactful for marketers.
— There are inventory advantages for native social ads because of the time spent in social apps and the scrolling layout.
–Ad blockers are accelerating the marketplace’s inevitable shift from lazy banner ads to more blocker-immune material like content marketing.
— Millennials, now the primary consumer demographic, are big on authenticity, which makes them untrusting of traditional advertising such as banners.
For all of these reasons, content marketing through social channels, such as Facebook news feed ads and Snapchat Stories, are showing much better campaign performance when done right.
“Done right” is where the emphasis should lie…. campaigns should feel organic and native to the app experience in which it resides. That doesn’t mean color scheme, it means deeper levels of messaging and functionality.
For examples of best practices in doing these things, check out Snapchat’s newly redesigned Discover channels, the creative uses of its Geo-filters, and several other examples listed here.
Localization
In addition to being untrusting of traditional advertising, millennials want things now. The same can be said for an overall “on-demand” culture that’s being conditioned by the smartphone to expect things at the push of a button.
This is all to say that ad campaigns should capture that high intent by having more calls to action to drive measurable conversions. This is seen in the rise of the “buy” buttons in popular social apps like Pinterest, Facebook and Instagram.
But where this will go next (as we’ve said) is beyond m-commerce. Because 93 percent of U.S. consumer spending happens offline, buttons and calls-to-action in ad campaigns should drive local activity. Think: call, map, book, reserve.
And that’s where things converge. Though native-social is currently the biggest driver of overall mobile ad revenues, it will really hit its stride — and impact mobile local ad revenues — when it more effectively drives offline commerce.
________
* These figures do not include tablets for reasons detailed here.
** Our applied definition of “Location-Targeted” is detailed here.
*** Native-social is defined as graphical and textual brand messaging that is merged into the organic feed-based interfaces of mobile social apps. These in-feed ads are targeted based on granular social signals (e.g., behavior and connections within the social graph), as opposed to traditional display ad targeting methods. In that sense, native social should not be confused with traditional display ads that are placed by ad networks as banner advertising, including those in social-oriented mobile apps. The latter would be counted in the traditional display category. The most common examples of native-social are Facebook’s News Feed Ads and Twitter’s Promoted Tweets. Instagram and LinkedIn have similar offerings, which continue to grow in prevalence and ad coverage.


