Media Access Pro FAQs
Welcome to the Frequently Asked Question (FAQ) Area for MEDIA Access Pro™MAPro Subscribers! On this page, you will find answers to frequently asked questions about MAPro. To help you, we’ve sorted questions by key topics like searching, creating maps, browsing station data, exporting data and much more.
Do you have a question not answered on this page? Email Georgina Santilli, and she will add it to this area. Plus, stay tuned to the MAPro client email that is sent out regularly.
Logging into and Using MAPro
Where do I log into MAPro Online?
The URL for MAPro Online is https://bia.datamark.live/
For best results, clear your cache before you use the new URL to access MAPro Online.
What help resources are available in MAPro?
Have you ever looked under the Help Menu in the MEDIA Access Pro Program? This section is filled with resources and information that are extremely helpful and informative. Please keep in mind that some of the data points outlined below can only be found in the Analyzer version of our program. Contact users can still see the definition and will be able to access the charts found in the categories. However, some of the data points will not be available in your subscription if you are a Contacts subscriber.
Content & Index: You can disregard this section. It directs you to an area that is no longer valid. Also, this link is disabled in the online version of MAPro.
User’s Manual: You will find this section also disabled with the online version. If you wish to receive a PDF version of our User Manual, please feel free to email me directly and I can forward you a copy of our User Manual.
Industry Overview: BIA Updates this section on a quarterly basis and it’s filled with Market Rankings, National Indices, methodology overview, keys and codes to most everything found in MAPro, Formats and their designated categories, and some nice trends about growth, revenue, and transactions.
Definitions: Most definitions can be found here like, Local Commercial Share, Metro Cume and many others.
Field Names: This PDF will provide you a PDF file of all searchable and exportable fields available in MAPro. The data fields available to you for searching and exporting purposes will depend on your subscription type (Contacts vs Analyzer).
Abbreviations: MEDIA Access Pro is filled with abbreviations. This section will pull an alphabetical pdf file that will provide the abbreviation name and the definition to that abbreviation. Formats, Affiliations, and other data filed abbreviations.
Price Codes: This section is extremely helpful to those users that subscribe to our Analyzer version. It comes in handy when you are trying to analyze details from the PRICE CODE filed found on that transaction tab.
Station Reps: Very similar to the Field Names and Abbreviations, this section provided a list of our Station Rep abbreviations along side the full name of the Station Rep.
Searching in MAPro
Can I sort data in the results tab?
After executing any quick search, new search, saved search, you can sort on any data point in the Results Tab. To do that, hold your cursor over the title (example below, hovering over Lic. Class) and then Right Mouse click. MAPro will automatically move the field to the far left side of your results tab and sort in Ascending order (1,2,3 or A, B,C), which is the default.
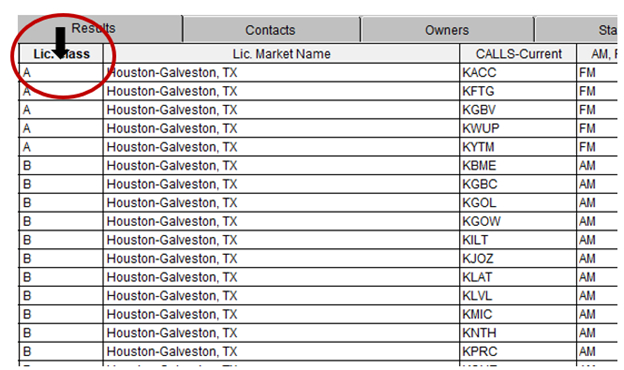
If you Right mouse click the field name again, MAPro will resort in Descending Order (3,2,1, or C,B.A), changing the order on your results tab.
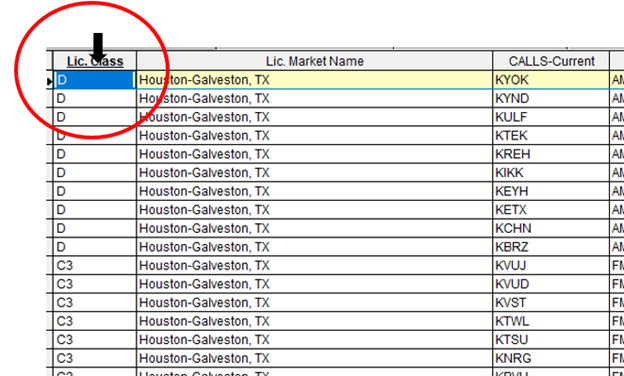
Short and sweet, but valuable when you want to see the data in a certain order.
How can I easily do a competitive assessment of stations in a market?
If you are a Radio or TV Analyzer subscriber and you haven’t explored the Competition Tab here is a quick overview on how you can quickly see station competition listed by revenue.
After executing any search, click on the Competition Tab. This tab displays all the stations in a market ranked by revenue. The top station in a Market is listed at the top of the list.
At the bottom of the window, the buttons allow you to export the fields displayed in the window into an Excel spreadsheet. To do this function, click the Export Competition Table to Excel button.
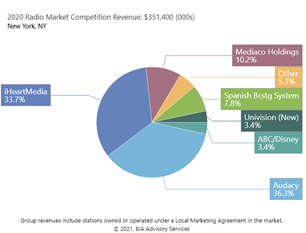
If you want to see a graph view of the market competition, click the Market Group Revenue Shares button. This view nicely shows which owner has the bigger piece of the pie in the Market.
See examples of these export options below.
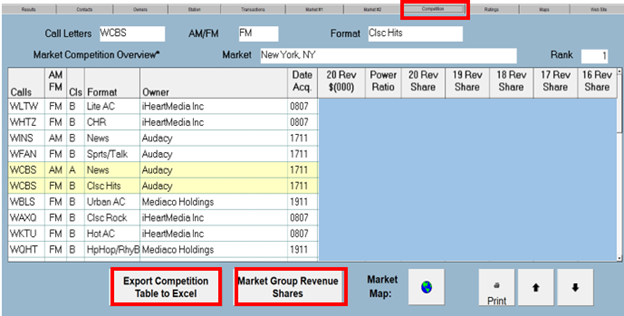
Excel Export

Group Revenue Share Chart
How can I do mult-criteria searches in MAPPro?
Many of you frequently use the Quick Search option in MEDIA Access Pro (MAPro) to find data you want quickly. What you may not know though is that this search offers you the ability to do more detailed, custom searches. One example is a multi-criteria search, meaning the stations you are looking for must meet certain criteria to show up on your results tab.
Let’s look at an example. The stations I want to find must meet the criteria below:
- Stations must be Sports
- FM stations only
- Generate 2 million or higher in Revenue in 2020
- Located in Markets 25-50
To do this search, start by clicking New Search. This brings you to the Selection criteria tab. On the left side, you will see a long list of fields available to search by. Add each line item to your criteria box using the steps shown below.
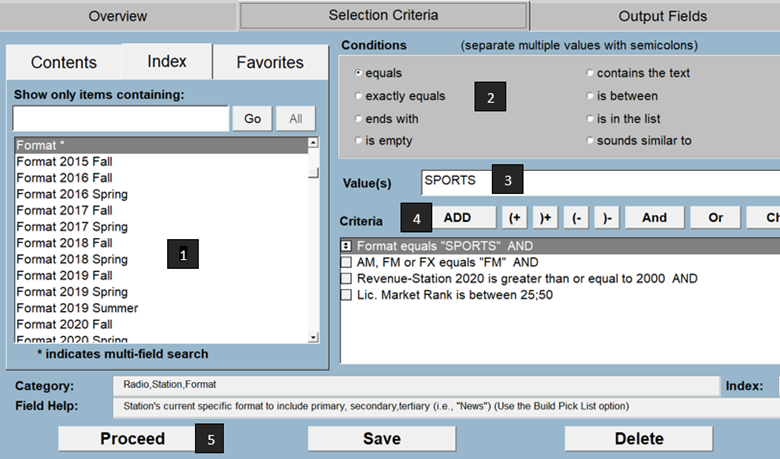
- Select the field you want to add to your criteria. In this example, we are searching on Format.
- Select the condition. The format we are looking for must Equal.
- My Value will be the Value of the Format we are searching for. In this example, it shows I am looking for all Sports formatted stations.
- Once you make the selections, press the Add button to add each line to the criteria box.
- After adding each line, the system automatically adds and AND statement. This is normal and next week I will go over working with the OR statement.
- Click the Proceed button to execute the search.
After adding your first line of criteria (format equals sports) move on to the next criteria line. For the example above, I am requesting that all stations be FM only. You will continue adding each line of criteria to your search.
Please note: The Conditions are what controls most of your criteria. For example, the last line in the screen shot, Lic. Market Rank is Between 25;50. The condition is between controls the output. In MAPro, all values are separated with a semicolon (;), therefor you will see a semicolon separating 25;50 and the condition of Is Between is letting MAPro that you wish to see all Markets that are between 25 and 50.
Can I use an "or" in a multi-criteria search?
I will show you how to add information into your criteria box but this time we will be using the OR statement as our statement separator. Last week we created a list of all FM Stations with a format of Sports, in markets 25-50 and these stations had to generate more than 2M in revenue.
I have included last weeks screenshot as a reminder. If you note at the end of each line, it has the AND statement.

This week we are going to work with the OR statement. A good example of using the OR statement separator would be if you are searching for multiple CALL Letters, Multiple Formats or Markets. For today’s example I will search on Multiple Markets. Using the above number sequence, I will ask MAPro for 4 different Markets.
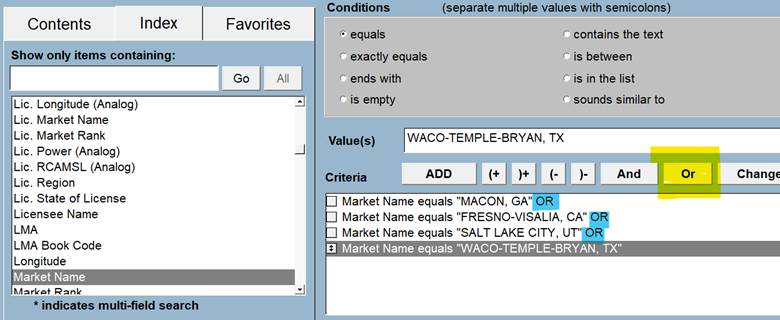
After you add each line to the criteria box the system will default and add the AND statement separator, after adding all Markets, go back on the control keys (highlighted in Yellow) and change each line containing the AND statement separator to the OR statement separator (highlighted in Blue). Once you click Proceed and your output should look something like this:

How do I eliminate duplicate records on my search results?
MEDIA Access Pro has a hidden function that is very rarely used. I get the same response when I show users how this feature works and how much time it saves. We call this the “unique” Filter. Once I show you how it works you will use it all the time.
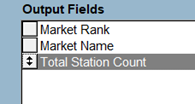
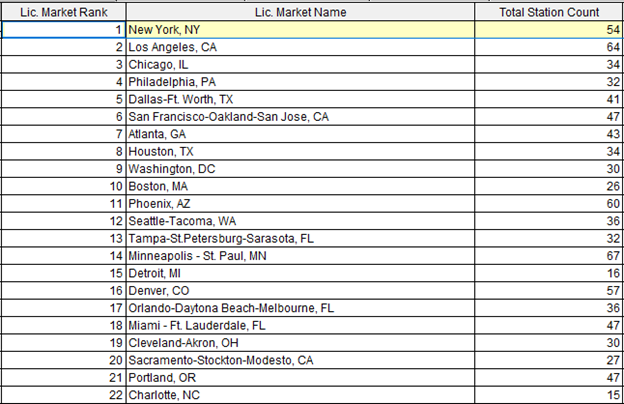
Let’s say you want to see total number of stations that makeup each Television or Radio Market. As you can see in my screen shot, I selected the 3 columns that are most important to me in my output fields tab: Market Rank, Market Name, and the Total Station Counts in each Market. New York shows 54 stations that makeup that market. MAPro is designed to search each individual station that meats your criteria, which means if you do not use the Unique filter, you will see New York 54 times with the same 3 fields of information.
Here are the steps you need to take when building your search.
I started a new search, in my search criteria I told the system to only find station that fall into a rated market therefore, the market rank should not be empty.

I then went to my output fields tab to select the 3 specific fields of information that are relevant to my search, those fields for this search were Market Rank, Market name and Total Number of stations in the market and that field is called “total station count”
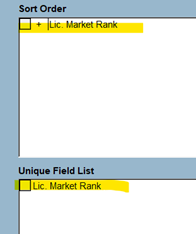
Lastly, I configured MAPro to sort the data and eliminate duplicates on one specific field name. I added Market Rank to my Sort order, and I accepted the default Ascending order (+). Then I added Market Rank to the unique field box. This is telling MAPro, If you see the Market Rank one time don’t repeat that line, I only wish to see it once.
After I execute the search by clicking Proceed, my results look just like my screen shot. Its listing all Markets that do not have a blank Rank, followed by the Market Name and the total number of stations per market.
Now, here is the great thing. You can make any field unique. If you are searching on specific data about an owner and you do not wish to see the same detail listed multiple times your unique box would include Owner, that way if MAPro finds the owners name once it wont duplicate it.
This field also comes in handy when you are exporting personnel (emails) from MAPro, and you do not want to see the email address duplicated in your output.
That’s it, form here all you do is Export to Excel and the data is yours to manipulate any way you wish.
Can I create a custom list of field names to search on?
When creating a New Search, the fields list can be a little overwhelming. Well, I have a way to condense your list by adding your most frequently used filed names to your Favorites tab.
Adding specific fields (the field used most often) can make your field selections so much more manageable. Below are the steps you will take to add your most frequently used field names to your favorites tab.
- Click the New Search Tab.
- From the list of fields listed alphabetically on the Index Tab, make your selection. For this example, I will choose Calls-Current
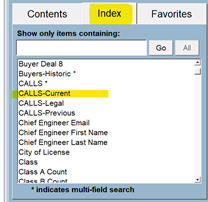
- After making your selection from the Index Tab, click the Favorites Tab to the right of Index.
- You will note Calls-Current displayed on my Current Selection Window.
- Now, Click the Add Button to the right of the Current Selection Field Box
- This will Add that field name to the list of favorite fields.
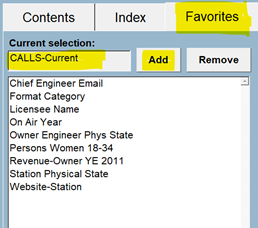
That’s it, from this point you can continue to add your most frequently used fields to your favorites box and completely customize the field names you see making it a little easier that scrolling up and down so many field names. Keep in mind, you can also Delete (Remove) any field names by selecting the Field name from the list of Favorites and clicking the Remover button.
Is there an easy way to search for a particular field name in MAPro
MAPro has so many fields of information, upward in the thousands of fields. How does one remember all those field names?
I will show you how to search on a field name even if you can’t remember that specific field name.
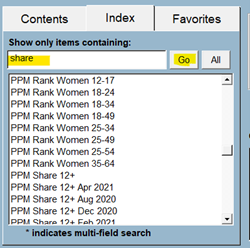
Get into the program, start to build your search using New Search function. The program defaults to the Index tab. Just under the words “show only items containing” type in the word you wish to search.
For this example, I will type the word SHARE then click the GO button. The index list will update and pull up any field name that has anything to do with the word Share or any word that it finds that contains the word share in it. From there you can scroll up or down to find the field you wish to work with, once you are done you can click ALL, and everything will default to the original list of fields.
How do you search for stations within 25 miles (or any desired distance) from a specific situation?
To see the distance in miles from one station to the other (distances are calculated from tower to tower) Also if someone wants to plot 2 or more stations on a map to see if they overlap one another based on their coverage area. This search is available to Radio and TV Analyzer users. These are the steps you would need to take.
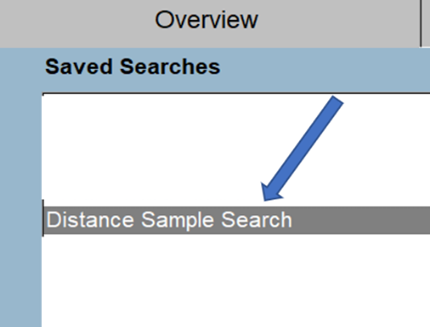
- Click Saved Search button on the opening page, in the Overview Tab scroll down alphabetically till you find the search called Distance Sample Search.
- Once that search is selected in the list of Saved Searches, click on the Selection Criteria Tab. Once one this tab you will modify or add your 3 sets of criteria.
- Call letters of the main station (please note, you can also use Zip Code or Lat/Long if you prefer
- Next, plug in the distance in miles you wish the program to search
- Click ADD once you have defined your search Criteria
For this example, I am searching for all stations that are 1-25 miles from station WENY
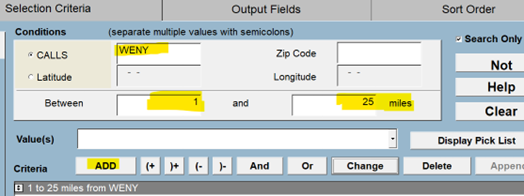
- From this point you will click the proceed button at the bottom of the Selection criteria window.
Her is one of the reasons I like this SAVED SEARCH so much. The program automatically builds the output fields for you. It displays all the stations with the mile market as part of your output.

What do the Change, Delete, and Append buttons do in the Selection Criteria Tab?
Let’s look at the Change, Delete and Append Buttons.

These buttons do exactly what their name indicates.
Change button. Will change (replace) and existing highlighted line in the criteria box.
Using the Change Button
Before:

Making sure the criteria line is highlighted, change your value, then click Change:
After:

Delete Button: Will Delete (remove) an existing line in the criteria box.
Using the Delete button
Before:

Making sure the criteria line is highlighted, then click Delete:
After:

Note: don’t forget to remove the AND/OR statement at the end of the line that remains in the criteria box.
Append Button. Will Append an item to the end of your existing criteria line. This button is best used when working with the condition Is in the list.
For example, say you want to search on multiple CALL signs: KAWE, KUTV and KTEJ. Begin by adding the first line to your criteria, as shown below:

Step 1- Select the second call letter from your drop-down value list.
Step 2- Click Append

Your Criteria line will now look like the image below. Both CALL letters separated with a Semicolon (;).

Do steps 1 and 2 above again, adding the next set of CALL letters from your drop-down Value list.

Note: there are some limitations to the number of characters per line. A good rule of thumb is to add about 10 CALL letters per line, then begin a new line (with an OR separator)
Creating Maps
What types of maps can I generate in MAPro and how do I create them?
One of our most popular modules is the coverage map module. This module works in conjunction with MEDIA Access Pro, and you cannot use one without the other. The mapping program is extremely flexible. The type of maps you can create are endless. Below are just a few examples of the different type of maps I have helped our users create.
- Owner search: You can search on a specific owner and view all the stations on a map across the US.
- Market Map Search: Search a Market and display all or a few stations from the market on your map.
- Stations search side by side: Most people will do this map to show the distance between 2 or more stations or to see if specifics station overlap one another.
Below are the steps to generate such maps:
- Owner Search: Easiest is to do a Quick Search on the Owner. When you get to the results tab displaying all stations, go to the MAPS tab and click on the selected stations button (incidentally this is the default button) then click build map. Once in Maps you will see all the stations owned by that specific owner on the left side of your screen, you can select some or all stations followed by the reload button.
- Market Map: Also, easily done using quick search on market, once on the results tab, click the MAPS tab, select the market button followed by the map button. Then, from the list, select a few stations or all stations followed by the reload buttons.
- Stations side by side: Or anything side by side, like owners, markets, etc. This can ONLY be done using the NEW SEARCH feature. To add two different call signs, click Calls-Current on the list of available fields, select IS IN THE LIST as your condition and type each call letter in the values box separated by a semicolon (see image below). Second example Listing each call individually one line at a time. Click Calls-Current, Select Equals, then type your call letters into the value box then ADD to your criteria. You can continue to add as many call letters you wish but always remember to change the AND to OR using the control keys (see image below)

When using the below method, ALWAYS use an OR separator, not the default AND. You can change this on the control keys above the criteria box.

Map results:
- Station Selections (check mark) the stations you wish to display on your map.
- Reload will draw those selected stations with a check mark onto your map.
- This is an important step; View Extent will redraw your maps and position everything on your screen. This is helpful because it automatically adjusts to the best view.
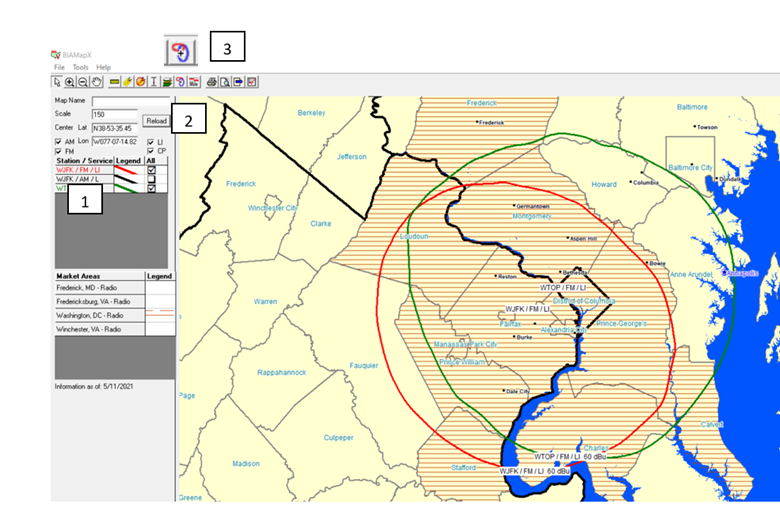
Mapping has so many more features and I will expand on them more in the weeks to come. If you feel you need a refresher session on working with maps or if you wish to learn how to enhance your maps email Georgina Santilli and setup a session with you or your group.
How cusomtizable are MAPro Maps?
MEDIA Access Pro has the ability to create custom mapping. The mapping program allows the end users to see station coverage, owner coverage, market coverage and what makes this program so unique is the ability to customize your maps.
Learn about the Properties window. This window allows slight modifications to the orientation of your pint job, modifying the export properties, which contours to turn on and off, saving layers and what detail to display on your contour names.
Now, how do you get to Properties? Easy, Go to File (on your menu bar) and select properties to display this window below.
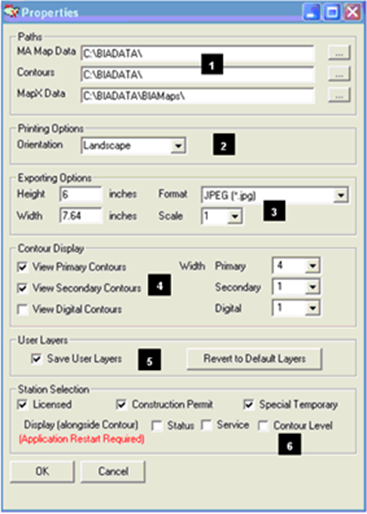
- Paths – This section only needs to be modified if your company is planning to install the mapping program on a network server. Since most users are using MAPro and Maps online this section does not need to be changes.
- Printing Options – Allows you to set the print direction, Portrait or Landscape, for your map output. Landscape is the installed default.
- Exporting Options – This section sets the parameters for exporting graphic images of the maps you create.
- Height – Set the default height of the map image you export. When you do, the width is automatically adjusted to provide you with a proportional image of the map you export. Width – Sets the default width of the map image you export. When you do, the height is automatically adjusted to provide you with a proportional image of the map you export.
- Export Format – Select your preferred graphic image format for output. Built-in formats from which to select include: wmf, bmp, gif, JPEG (the default), TIFF, PNG, PSD
- Export Scale – 1 = regular output, 2 = doubles the size, 3 = triples the size of your graphic, etc.
- Contour Display – When checked, the appropriate Contours (Primary or Secondary or Digital) for Radio or Television stations (digital not displayed for Television) will display on your map. Within this box you can also set the default width of the contour lines for the Primary and Secondary Contours (1=Narrow and 4=Thick).
- User Layers – If you have modified specific layers in the mapping program and wish to save them, you will click the Save User Layers box to save your settings. I will cover modifying your Mapping Layers in the weeks to come.
- Station Selection – Eliminating stations from your maps along with the labels that display on your contours: Licensed, Construction Permit, Special Temporary, its best to leave this section types ON so that you see all station types on your map.
- Display alongside Contour: Turn on or off which ever you would like to see alongside of your station call sign. See detailed list below along with codes:
- Status that the contour portrays:
- LI or L=Licensed
- CP or C= Construction Permit
- ST = Special Temporary Authorization
- FCC service of the station
- AM = AM Radio
- FM = FM Radio
- TV = Analog Television (NTSC)
- TX = Television Translator
- CA = Class A Television
- DT = Digital Television (ATSC)
- DS = Digital Special Temporary Authorization
- ST= Special Temporary
- LP= Low Power
- Contour level: This will display the dBU level, 60, 70, 65 (Radio) and 51, 41 36 (Television)
- Status that the contour portrays:
Can I build a map that shows the distance between stations?
Once you know how to do to find all the stations that fall within a 25-mile radius. You can plot out those stations on your map in the order of distance from the main searched station. The results delivered from the saved search allow you to see the distance (tower to tower) between the main station (WENY) and the next station sorted by distance.
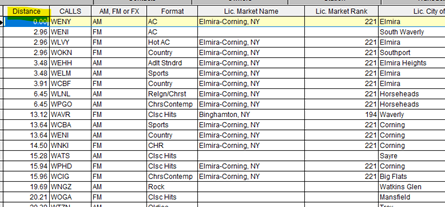
As you can see WENI-FM is 2.96 Miles from WENY-AM and so on. We will now plot these stations on our mapping program. Here are the steps you need to take to plot these out by distance.
Click the MAPS Tab to the far-right side of your screen
Step 1- Choose Selected Stations
Step 2- Search Results Order
Step 3- Build Map
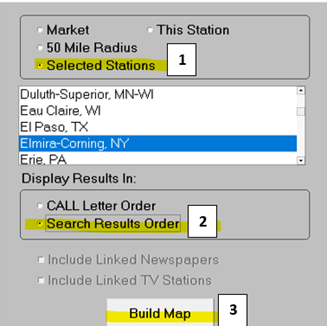
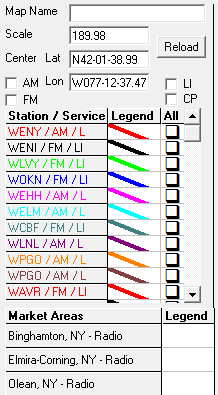
After clicking Build Map a second application will open, MapX Viewer and you will note the stations listed on the left side of your screen are all in the results order that was displayed on your Results tab.
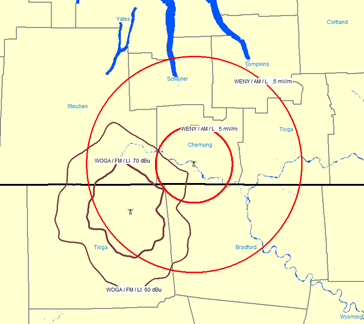
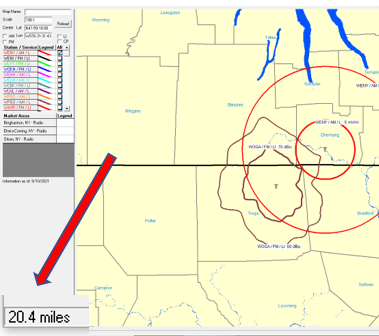
This is helpful if you want to see how close or far stations are from the main station (WENY). My affiliate people love this search because it allows them to see if a station falls within a 50-mile radius to allow a station in the same market to carry programming. The map below shows how I plotted 2 stations on my map and the best part, if I use my ruler bar (image below) I can click hold drag my mouse across my map to plot out the distance in Miles.
Ruler Bar on the task bar shown below.

Measurement in distance is displayed on the lower left side of your screen and it moves up or down as you move your mouse. Note: you must click hold and drag your mouse to see the measurement.
How can I colorize contours and market areas on the map?
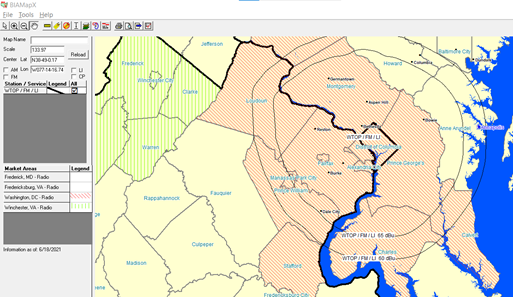
Using WTOP- FM in Washington DC as an example. (Note: keep in mind the functionality works the same in TV as it does in Radio.) Do a quick search of WTOP, click the Maps Tab and then build your map on Selected station.
When the mapping program is launched, you will turn on or select the station(s) of the contours you want to display by putting a check mark in the box to the right of the station and turning this contour on.

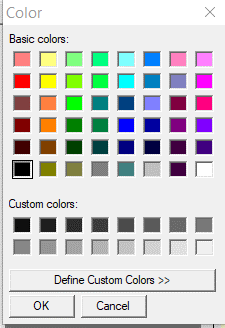
If you want to change the color of your contour to something other than the default, simply Right mouse click on the call signs to open a color pallet box in which you can choose any color and then click OK. I will change WTOP from the default Red to Black.
If you want to shade the Market areas of your map (the radio/tv markets that are served by the station/stations), select the market to Shade. For this example, I will choose Washington D.C. and the Winchester Market areas,
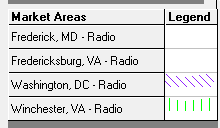
After clicking on the Market name, a region style window will open. The only changes you will need to make are at the top of the Fill Window. Select a Pattern and then Select a Foreground color. For my example, I will select a pattern and a green for Winchester and a different pattern and purple for Washington D.C.
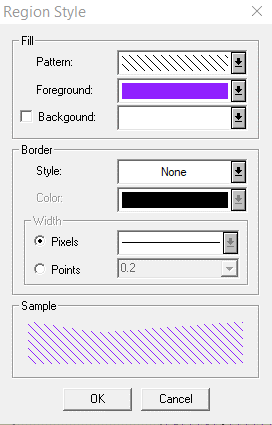
Once you have made all your selections, click the Reload Button. This will pull your changes into your map.
Below you can see my sample map. It shows WTOP in a Black Contour color and the two market areas are shaded in the green and purple patterns. By doing color selections, you can see that WTOP definitely has listeners in the Washington DC area, and it also shows how close the signal is to the Winchester, VA Market.
What are the functions of the icons on the Maps toolbar?

![]() Arrow – This tool is used to go back to the arrow after selecting any of the functions on this bar. It will turn your mouse cursor back to an arrow.
Arrow – This tool is used to go back to the arrow after selecting any of the functions on this bar. It will turn your mouse cursor back to an arrow.
![]() Zoom In – Every time you click using this tool, you will zoom in closer on your map to reveal more details. To reverse the process, click on the Zoom Out icon described below.
Zoom In – Every time you click using this tool, you will zoom in closer on your map to reveal more details. To reverse the process, click on the Zoom Out icon described below.
![]() Zoom Out – With each click of this button you zoom out farther to get a more expanded view of the map. Click on the Zoom In button to reverse the process.
Zoom Out – With each click of this button you zoom out farther to get a more expanded view of the map. Click on the Zoom In button to reverse the process.
![]() Pan – Click on this tool to manipulate the placement of the map in the viewer. Left click, hold, and then drag the map. Release the left mouse button and the map will redraw to incorporate the new view.
Pan – Click on this tool to manipulate the placement of the map in the viewer. Left click, hold, and then drag the map. Release the left mouse button and the map will redraw to incorporate the new view.
![]() Ruler Bar – Allows you to measure the distance from one point to another on your map. The ruler bar will be selected, click hold drag the area that you wish to measure. The results will display on the lower left side of the window measured in Miles.
Ruler Bar – Allows you to measure the distance from one point to another on your map. The ruler bar will be selected, click hold drag the area that you wish to measure. The results will display on the lower left side of the window measured in Miles.
![]() Label – The label tool allows you to apply a label to elements on your map. Click on this tool and the cursor changes to a crosshair. Click in the area you wish to apply a label (NOTE: the crosshairs depict the center of the placement of the label). After a few moments, a table will appear with all the available items that can be labeled in that location. Click on the desired item and then click on OK. Your label should appear. You cannot move this label once you place it, so you will need to use the Remove Label tool to delete it and then reapply the label in the more desirable location.
Label – The label tool allows you to apply a label to elements on your map. Click on this tool and the cursor changes to a crosshair. Click in the area you wish to apply a label (NOTE: the crosshairs depict the center of the placement of the label). After a few moments, a table will appear with all the available items that can be labeled in that location. Click on the desired item and then click on OK. Your label should appear. You cannot move this label once you place it, so you will need to use the Remove Label tool to delete it and then reapply the label in the more desirable location.
![]() Remove Label – Click on this tool when you wish to remove a label. The cursor changes to an outlined arrow. Click on the label and it will turn to red and then disappear from the map view.
Remove Label – Click on this tool when you wish to remove a label. The cursor changes to an outlined arrow. Click on the label and it will turn to red and then disappear from the map view.
![]() Annotate – Use this tool to customize your map with text. Click on the map in the location you want to place the text. A small, gray-bordered box will appear with a blinking cursor inside. Begin typing and the box will expand to accommodate your text. To adjust the point size of your annotation, place your cursor over one of the corners, left click and drag to the desired text size. Press Enter to set your text. To move your annotation, left click on the text, the gray box will reappear, and a crossed double arrow will appear. Left click, hold, and drag the text to the desired position. To delete an annotation, click on the text to activate the gray box and then press the Delete button on your keyboard.
Annotate – Use this tool to customize your map with text. Click on the map in the location you want to place the text. A small, gray-bordered box will appear with a blinking cursor inside. Begin typing and the box will expand to accommodate your text. To adjust the point size of your annotation, place your cursor over one of the corners, left click and drag to the desired text size. Press Enter to set your text. To move your annotation, left click on the text, the gray box will reappear, and a crossed double arrow will appear. Left click, hold, and drag the text to the desired position. To delete an annotation, click on the text to activate the gray box and then press the Delete button on your keyboard.
![]() Layer Control – Clicking on this button will open the Layer Control window wherein you can adjust the display of various elements on your map. I will cover this in more detail on my next client update so stay tunned for that in a few weeks.
Layer Control – Clicking on this button will open the Layer Control window wherein you can adjust the display of various elements on your map. I will cover this in more detail on my next client update so stay tunned for that in a few weeks.
![]() View Extent – Click on this button to automatically adjust the zoom and center your map to include the elements that you have mapped.
View Extent – Click on this button to automatically adjust the zoom and center your map to include the elements that you have mapped.
![]() Scale Bar – Click on this tool to apply a scale bar to the upper left corner of your map. As you adjust your zoom, the scale bar will change accordingly.
Scale Bar – Click on this tool to apply a scale bar to the upper left corner of your map. As you adjust your zoom, the scale bar will change accordingly.
![]() Print – When clicked, this icon will launch the Print dialog box.
Print – When clicked, this icon will launch the Print dialog box.
![]() Print Preview – Click this button to view your map output prior to printing.
Print Preview – Click this button to view your map output prior to printing.
![]() Export – Activate the export option by clicking on this button.
Export – Activate the export option by clicking on this button.
![]() Properties – Open the Properties box by selecting this icon. This will be covered in more detail in the weeks to come.
Properties – Open the Properties box by selecting this icon. This will be covered in more detail in the weeks to come.
Browsing and Using Station Data
What Is a Translator Station?
What is a Translator Station? – simultaneously rebroadcast the signal of a primary AM or FM station on a different frequency. Those translator stations that provide service within the primary station’s protected service area are classified as “fill-in” stations. Fill-in translators can be owned by the main station or by an independent entity. Commercial non-fill-in translators are generally owned by independent entities, with certain exceptions, while noncommercial educational non-fill-in translator stations are generally owned by the primary station being rebroadcast.
In MAPro you can look up Translators in a few different ways:
- Using quick search, Select CALLS, type in the parent station or the translator station calls then hit search.
- When you get to the results, click on the Contacts tab. On the upper left side of the screen, if you see a button and if the Translators button is bold, it means that has a translator station associated with it.
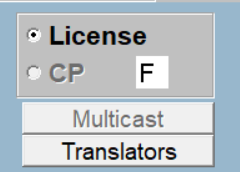
- When you click on the translator button it will open a box with all the details of the Parent station as well as any translators associated with that main station.

You can also modify your output fields (covered on the April 22 weekly update)
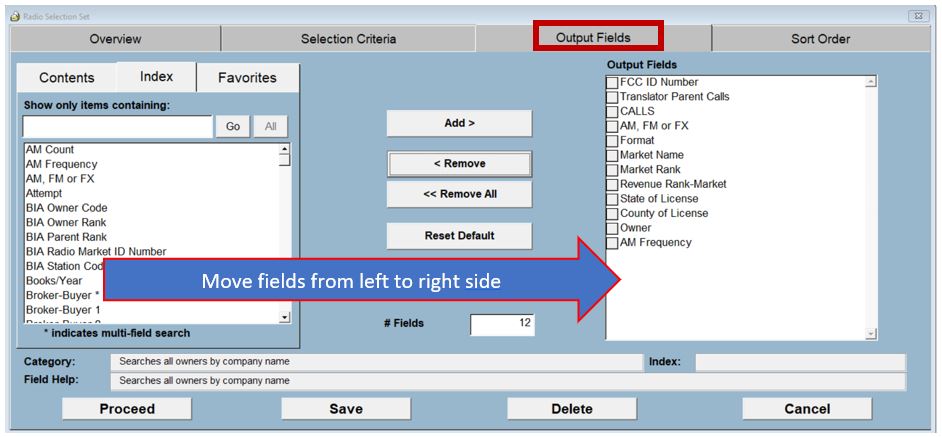
When modifying your Output fields, you must add both, the parent station (translator parent calls) and station (Calls) as well as any other fields of information that you are interested in viewing. Below is just an example.
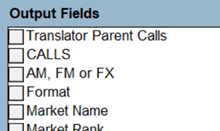
You will then search a Station, Market or Owner. Your Results tab will display the following (based on the screen shot above:
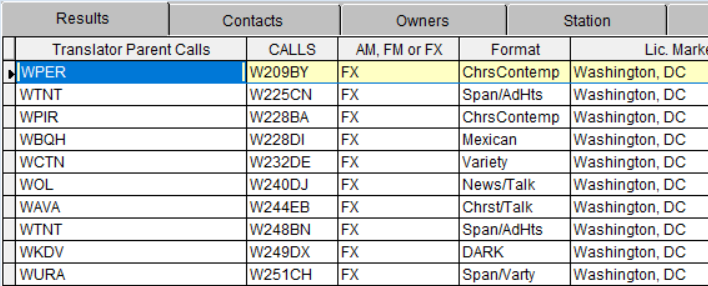
The above shows WPER has an FM Translator that is W209BY and so on.
The Method shown above will work the exact same way in the Television MAPro.
How can I look up other stations in a market?
When you click on the Market #1 Tab you will note a button at the bottom of the window Other Stations In Market this button will quickly display all other stations that fall into that specific market.
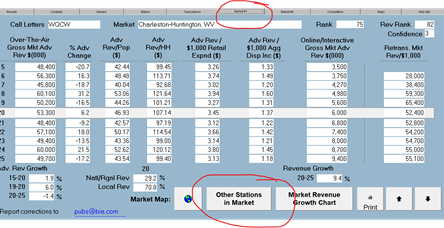
The nice thing about this pop-up window is you can see a listing of all the other stations that fall into that market, plus additional details for each station, like total number of stations in that market and the total number of different owners in the market. You can simply view the details on your screen or print this detail to your printer or a pdf format.

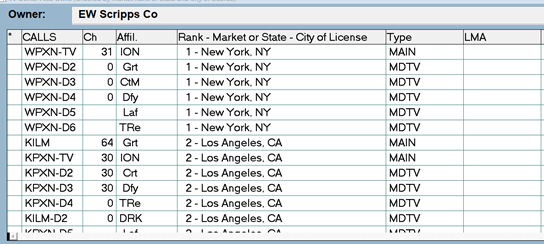
One last thing on this screen is you can quickly pull an owner list by clicking the ? box to the right of the owner. This will not just pull up all the stations owned by that specific owner in that market, but it will pull all of the owner holdings across the US.
What do I do if I can't find a station?
If you cannot find a station the first place to look is the pop-up box Search Only the following stations that are. This box will occasionally be accidently turned off and a one or more categories might have accidently been turned off.
The easiest way to make sure all station categories are turned on is to click on Quick Search button.
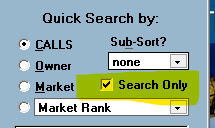
Make sure the Search Only check box is turned on. This will open the window Search Only the following stations that are. From this point you can turn on or off specific station that fall into whatever category you wish to see, or not see.
Below is a screen shot of the Radio Search Only box:
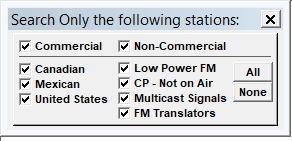
Below is a screen shot of the Television Search Only box:
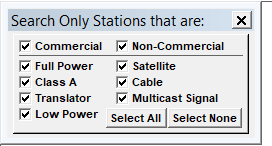
If you think the database is missing a station start here. Chances are you might have accidently unselected a category.
How can I find the FCC ID Number?
Using quick Search
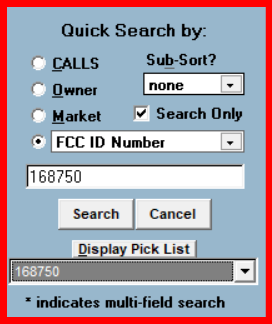
- Click the quick search button
 Select the fourth radio button
- Using the drop downscroll down alphabetically until you find the field name called FCC ID Number
- Clicking the Display Pick List (image below) will pull a list of ALL the FCC ID Numbers we have available in the system. You can certainly scroll down to locate the FCC ID number you are looking for or simply manually enter the FCC ID Number into the empty Filed box
![]()
![]()
- Once you Click Search, the program will search the entire database for the number you specified.
- One of 2 things will happen, the results tab will show your station in the list OR, if that number cannot be found you will get a message stating that the “Search String Cannot Be Found” meaning that FCC ID number was not located.
What does N/A mean it's listed as the most recent rating?
If you are a radio analyzer subscriber, you may be aware that Nielsen has made some changes with subscribers and non-Subscribers. I have good and bad news about these changes. First, the good news, BIA has reached an agreement with Nielsen, and they will continue to provide us the 12+ share data points for these Non-Subscribing stations. The bad news is that we need to work on a new data feed that will allow us to display that information on the existing Station Tab.
Now, if you stumble on a station and you see the N/A in the most recent rating period slot, it means that station has fallen into the non-subscriber category and for the time being it will display N/A. Our development team is working on a system that will allow us to display that information. Its currently a work in progress and I hope it won’t take long to get this datapoint displaying again on the Station Tab. I ask that you be patient with us during this transition and I promise to let you know as soon as we have the new data in place.
We strive to keep MEDIA Access Pro up to date, so our clients won’t miss a beat when it comes to their broadcast research needs.
Accessing Station Contacts
How can I see email address and other information for station personnel?
Many MAPro users like to view the email address for certain personnel at the station level on their results tab. Even though our Contacts Tab does not display the station personnel email information, there is a way to get (and see) the information easily.
Here is how to modify your default search so when you execute a quick search, the results will display the specific information you want like email addresses, owner details, or any datapoint that’s important to your everyday work situation.
How to do it:
- Click the New Search Tab.
- Click on the Output Fields Tab.
- From the right side of the screen, remove the fields you do not want on your output (results) and add the fields you want to have in your output (results) from the left side of the screen.
- Note: Add fields by double clicking the fields you want on your Results Tab. Think of the right side of your screen as if it were an excel spreadsheet.
- Once you have customized the output fields with the fields you want, click the SAVE button on the bottom of the window.
- Here is the important part. You should get a message that you are about to overwrite your default and it will ask if you are sure you want to do this. It is ok to say YES.
- Clicking the Save button will run the search and give you the results you requested.
- Now, every time you click Quick search, your Results Tab will only display the fields of information you requested
Exporting Data
How can I export data out of MAPro?
Exporting data fields out of MAPro is extremely easy, it just takes getting the hang of it. This task can be done one of 2 ways. You can export default fields from your executed quick search base on Calls, Market, Owner, or your own custom search.

When you get to the results tab click Export on the menu bar, choose Microsoft Excel. Export directions are slightly different for Online users Vs. Desktop users.
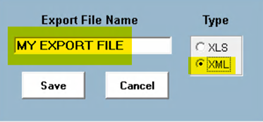
ONLINE USERS:
An Export File Name Box will open. Add your export name to the blank text box, please be sure to save in XML format. Using XML will always add the same field names you see in MAPro to the top of your Excel Spreadsheet. Using XLS will work also but the field names displayed will look a little different. Then click SAVE. This will automatically launch your Excel program with the fields displayed in your Results tab.
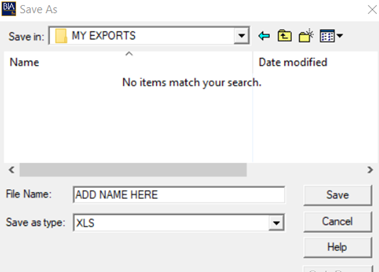
LOCAL WORKSTATION USERS:
SAVE AS box window will open, from this point you can change your SAVE IN folder by selecting the folder or drive you wish to export your results, give the export a FILE NAME, then click SAVE.
That’s it, your output will all be available in excel for you to manipulate and use.
What if I want to modify my output list and export different fields?
You will need to manually do this by using the NEW SEARCH function. I covered modifying your output fields on my April 19th Update, but I’m adding the steps to this update as well, so you don’t have to go back.
- Click the New Search tab.
- Click on the output fields tab.
- From the right side of the screen remove the fields you don’t wish to see on your output (Results/excel spreadsheet).
- Start adding the fields you wish to see in your output (results/excel spreadsheet) from the left side of the screen by adding each field.
- Once you have customized the output fields with your desired fields you can click Proceed to get to your results tab.
- From this point, you follow the instructions above to Export your data.
Revenue Updates
Takeaways from Investing in Radio, 1st Edition 2023
Radio Industry: Revenue Snapshot
- 2022 Total Radio Revenue Growth Rate: 7.4%
- 2022 Radio Over-The-Air Ad Revenue: $11 Billion, 2.2% YoY Growth
- 2022 Radio Digital: $2.6 Billion 35% YoY Growth
- Throughout BIA’s five U.S. regions, the Western region will receive the highest percent of revenue at 27.6%, followed by the Southeast at 20.5%.
 |
Radio Industry: Transactions
- Total Value of Radio Stations Sold: $300 million
- Total Number of Radio Stations Sold: 486
- The chart below shows transaction volume from 2018-2022.
|
Top Billing Radio Stations by OTA Revenue
- Washington, DC all-news station WTOP-FM maintained its long-time leading spot with $69 million in advertising revenue
- New to the list is WSB (AM) news/talk in Atlanta, GA, with $31.6 million in 2022 revenues.


